
The Design Process
Gantt Chart
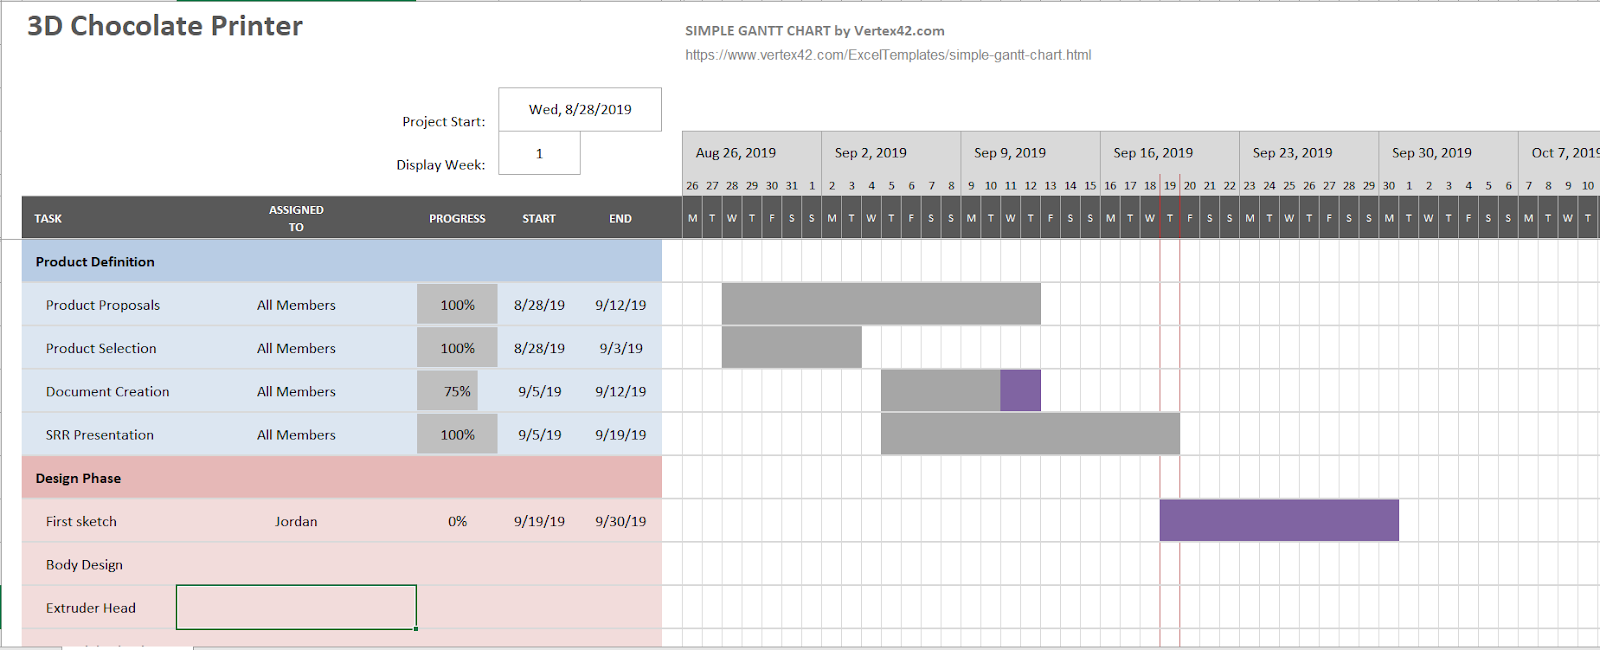 click on the Image next to the text to check out a full version pdf of our Gantt chart. This chart details the work periods for each subsection and who is in charge of that section. This chart also helps to show the current percentage of work done for any given subsystem.
Work Breakdown Structure
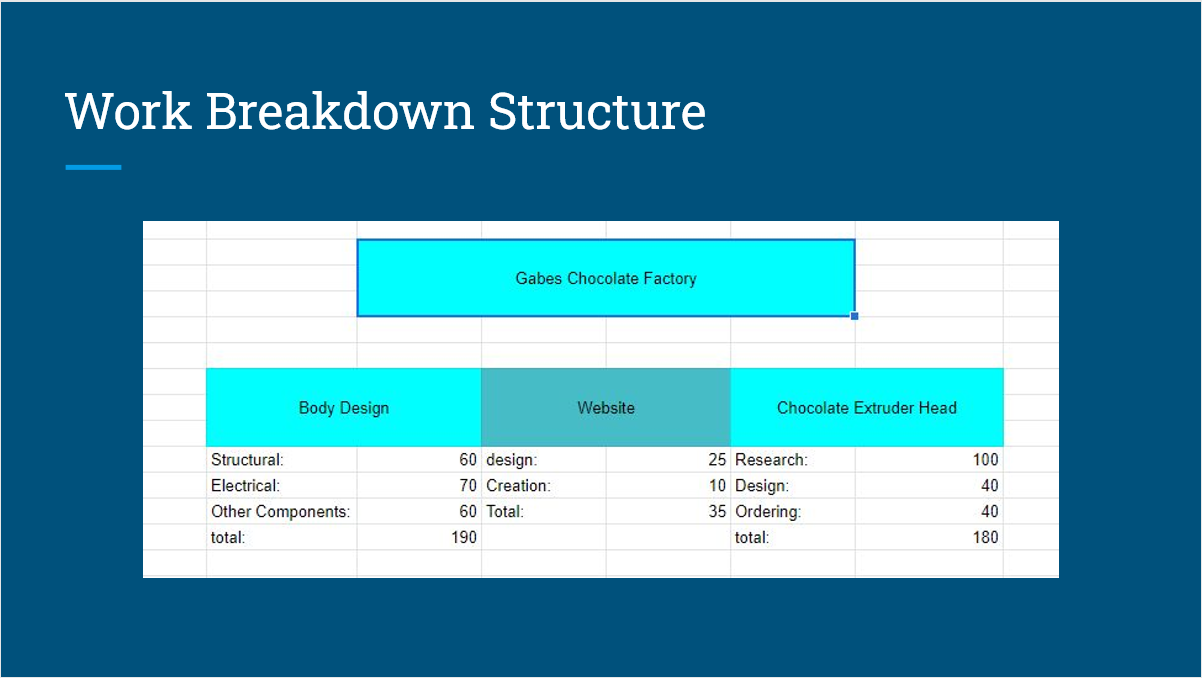 Clicking on the image will pop up a different tab in which you can manipulate or download the image as needed.