Given a set of “inputs” called a domain and a set of prospective “outputs” called a codomain, a function is a specific correspondence between this domain and codomain that pairs inputs and outputs such that every input is assigned a single output. The set of all outputs in the domain that correspond to an input is called the range. For an independent variable (input) \(x\) and dependent variable (output) \(y\) that depends on \(x\) according to function \(f,\) we write \(y = f(x).\)
 Typically the domain and codomain of a function will be the set of all real numbers,
but sometimes it’s only a connected subset of the real numbers called an interval.
E.g the interval \((a,b]\) denotes all real numbers \(x\) such that \(a \lt x \leq b.\)
Typically the domain and codomain of a function will be the set of all real numbers,
but sometimes it’s only a connected subset of the real numbers called an interval.
E.g the interval \((a,b]\) denotes all real numbers \(x\) such that \(a \lt x \leq b.\)
While a function, in general, is just a list of \((x,y)\) input-output pairs,
typically we study functions whose correspondence
is given by a formula which we denote \(f(x).\)
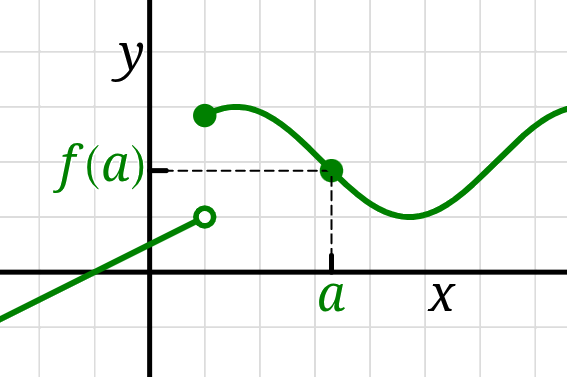
The set of solutions \((x,y)\) to the equation \(y = f(x)\)
plotted in the \(xy\)-plane is called the graph of the function \(f.\)
Since every input \(x\) of \(f\) is assigned a single output \(y\)
every vertical line in the \(xy\)-plane may only cross the graph of \(f\) at a single point;
a curve in the \(xy\)-plane can only be the graph of a function
if it passes this “vertical line test.”
For any two variables that measure some numerical phenomena, the relationship between those variables may be modelled by a function, and the phenomena those variables quantify can be studied by analyzing this model. Conventionally if an independent variable represents time, we denote it with the symbols \(t\) instead of \(x.\)