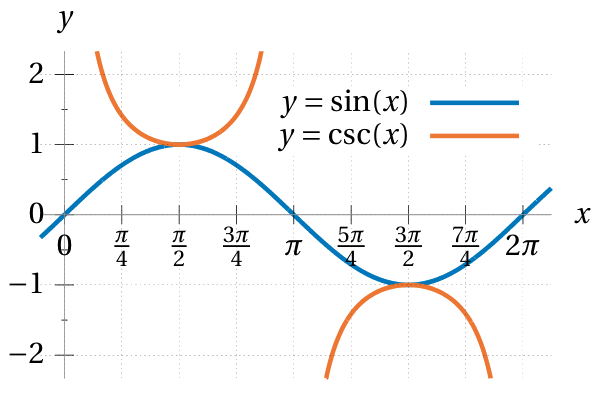
The graph of sine is the curve
consisting of all the points \(\bigl(x, \sin(x)\bigr)\) in the plane.
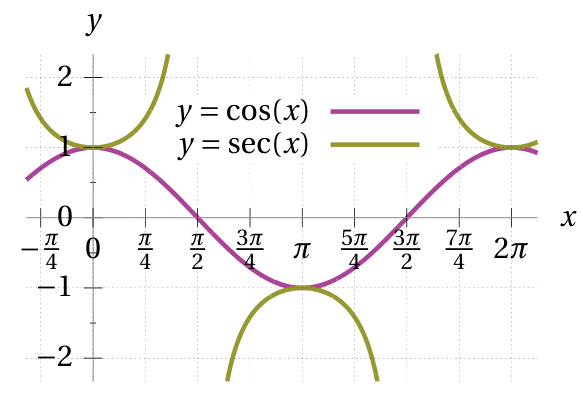
The graph of cosine is defined similarly.
A curve that is based on the graph of sine or cosine
is called a sinusoidal curve.
Sine and cosine are periodic functions,
with a period of \(2\pi.\)
I.e. for any integer \(n\)
\(\sin(t) = \sin(t + 2\pi) = \dotsb = \sin(t + 2\pi n).\)
The amplitude of a sinusoidal curve
is its maximal change in height from its midline;
sine has a default amplitude of one.
The phase shift of a sinusoidal is the horizontal shift
of the curve away from its parent sine/cosine graph.
Altogether, the graph of
\(a\sin\bigl(k(x-b)\bigr) + v\)
will have period \(\frac{2\pi}{k},\)
amplitude \(|a|,\)
and phase shift \(b.\)
It will be shifted upwards by \(v\)
but we have no vocab term for that.
Secant and cosecant also have period of \(2\pi.\)
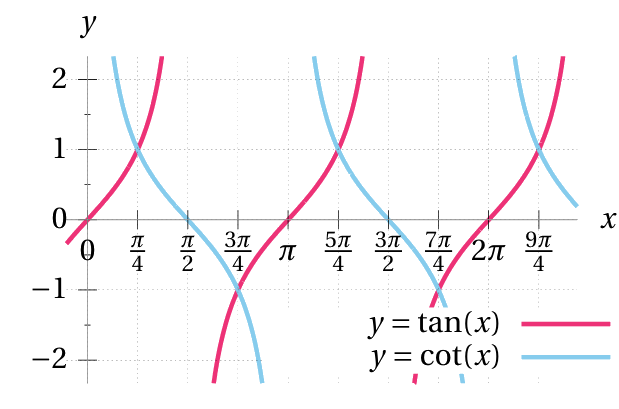
Tangent and cotangent however have a period of \(\pi.\)
The graphs of these functions have vertical asymptotes
at the holes in their domain.
The graph of sine is the curve
consisting of all the points \(\bigl(x, \sin(x)\bigr)\) in the plane.
The graph of cosine is defined similarly.
A curve that is based on the graph of sine or cosine
is called a sinusoidal curve.
Sine and cosine are periodic functions,
with a period of \(2\pi.\)
I.e. for any integer \(n\)
\(\sin(t) = \sin(t + 2\pi) = \dotsb = \sin(t + 2\pi n).\)
The amplitude of a sinusoidal curve
is its maximal change in height from its midline;
sine has a default amplitude of one.
The phase shift of a sinusoidal is the horizontal shift
of the curve away from its parent sine/cosine graph.
Altogether, the graph of
\(a\sin\bigl(k(x-b)\bigr) + v\)
will have period \(\frac{2\pi}{k},\)
amplitude \(|a|,\)
and phase shift \(b.\)
It will be shifted upwards by \(v\)
but we have no vocab term for that.
Secant and cosecant also have period of \(2\pi.\)
Tangent and cotangent however have a period of \(\pi.\)
The graphs of these functions have vertical asymptotes
at the holes in their domain.