Exercises
For any of the following functions, manually sketch its graph, taking stock of its period, amplitude, and phase shift and considering how to scale the coordinate axes to accommodate the graph. Once you’re confident in your sketch, plot the graph of the function using a graphing calculator and compare it with your sketch.
\(\displaystyle a(x) = -\cos(x)\)
\(\displaystyle b(x) = \sin(-x)\)
\(\displaystyle c(x) = -\sin(x)\)
\(\displaystyle d(x) = 5+\sin(x)\)
\(\displaystyle e(x) = 3-\cos(x)\)
\(\displaystyle f(x) = \cos(2x)\)
\(\displaystyle g(x) = \frac{1}{2}\cos(x)\)
\(\displaystyle h(x) = \frac{1}{2}\cos(3x)\)
\(\displaystyle i(x) = \frac{1}{2}\cos(x-180\degree)\)
\(\displaystyle j(x) = \cos\Bigl(\frac{1}{2}x\Bigr)\)
\(\displaystyle k(x) = 2-3\cos(x)\)
\(\displaystyle l(x) = 2-\cos\Bigl(\frac{1}{2}x\Bigr)\)
\(\displaystyle m(x) = 2-3\cos\Bigl(\frac{1}{2}x\Bigr)\)
\(\displaystyle n(x) = 1+\sin\bigl(2x\bigr)\)
\(\displaystyle o(x) = 1+\sin\Bigl(\frac{x}{2}\Bigr)\)
\(\displaystyle p(x) = 1+\sin\bigl(2(x-30\degree) \bigr)\)
\(\displaystyle q(x) = 1+\sin\Bigl(\frac{1}{2}x\Bigr)\)
\(\displaystyle r(x) = \cos\Bigl(x+30\degree\Bigr)+\frac{2}{3}\)
\(\displaystyle s(x) = \cos\bigl(3(x-20\degree)\bigr)\)
\(\displaystyle t(x) = \cos\bigl(3(x-180\degree)\bigr)\)
\(\displaystyle u(x) = \cos\bigl(6x-90\degree\bigr)\)
\(\displaystyle v(x) = \cos\bigl(4x-180\degree\bigr)\)
\(\displaystyle w(x) = \cos\bigl(3x+270\degree\bigr)\)
\(\displaystyle y(x) = \cos\Bigl(x+60\degree\Bigr)\)
\(\displaystyle z(x) = \cos\Bigl(3x+90\degree\Bigr)\)
\(\displaystyle \alpha(x) = \tan(-x)\)
\(\displaystyle \beta(x) = \sec(x)\)
\(\displaystyle \gamma(x) = \tan(5x)\)
\(\displaystyle \delta(x) = 5-\tan(x)\)
\(\displaystyle \varepsilon(x) = \frac{1}{2}\sec(3x)\)
\(\displaystyle \zeta(x) = \frac{1}{2}\sec(x-30\degree)\)
\(\displaystyle \eta(x) = \sec\Bigl(\frac{1}{2}(x-45\degree)\Bigr)\)
\(\displaystyle \theta(x) = \sec\biggl(\frac{1}{2}\Bigl(x-180\degree\Bigr)\biggr)\)
\(\displaystyle \iota(x) = \sec\Bigl(\frac{1}{2}x-30\degree\Bigr)\)
\(\displaystyle \kappa(x) = \csc\Bigl(\frac{1}{2}x-30\degree\Bigr)\)
\(\displaystyle \lambda(x) = -\csc\Bigl(2x-90\degree\Bigr)\)
\(\displaystyle \mu(x) = 3\csc\Bigl(2x-90\degree\Bigr)\)
\(\displaystyle \nu(x) = 3\tan\Bigl(2x-90\degree\Bigr)\)
\(\displaystyle \xi(x) = 3-\tan\Bigl(2x-90\degree\Bigr)\)
\(\displaystyle \omicron(x) = 3-3\tan\Bigl(-2(x-72\degree)\Bigr)\)
\(\displaystyle \pi(x) = \sec\Bigl(3 (x-180\degree)\Bigr)\)
\(\displaystyle \rho(x) = \csc\Bigl(3 (x-180\degree)\Bigr)\)
\(\displaystyle \sigma(x) = \sec(x-1000\degree)\)
\(\displaystyle \tau(x) = \bigl|\sec(x)\bigr|\)
\(\displaystyle \upsilon(x) = \bigl|\sin(x)\bigr|\)
\(\displaystyle \varphi(x) = \Bigl|3\sin(x-10\degree)\Bigr|\)
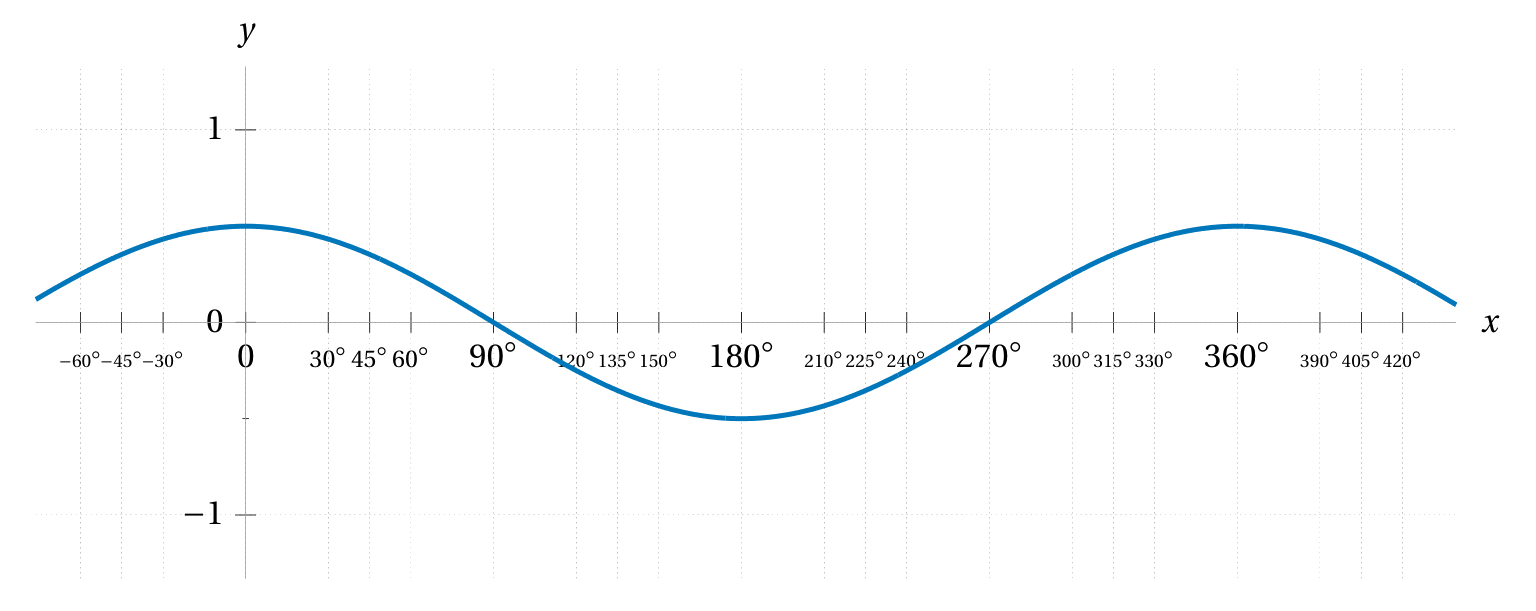
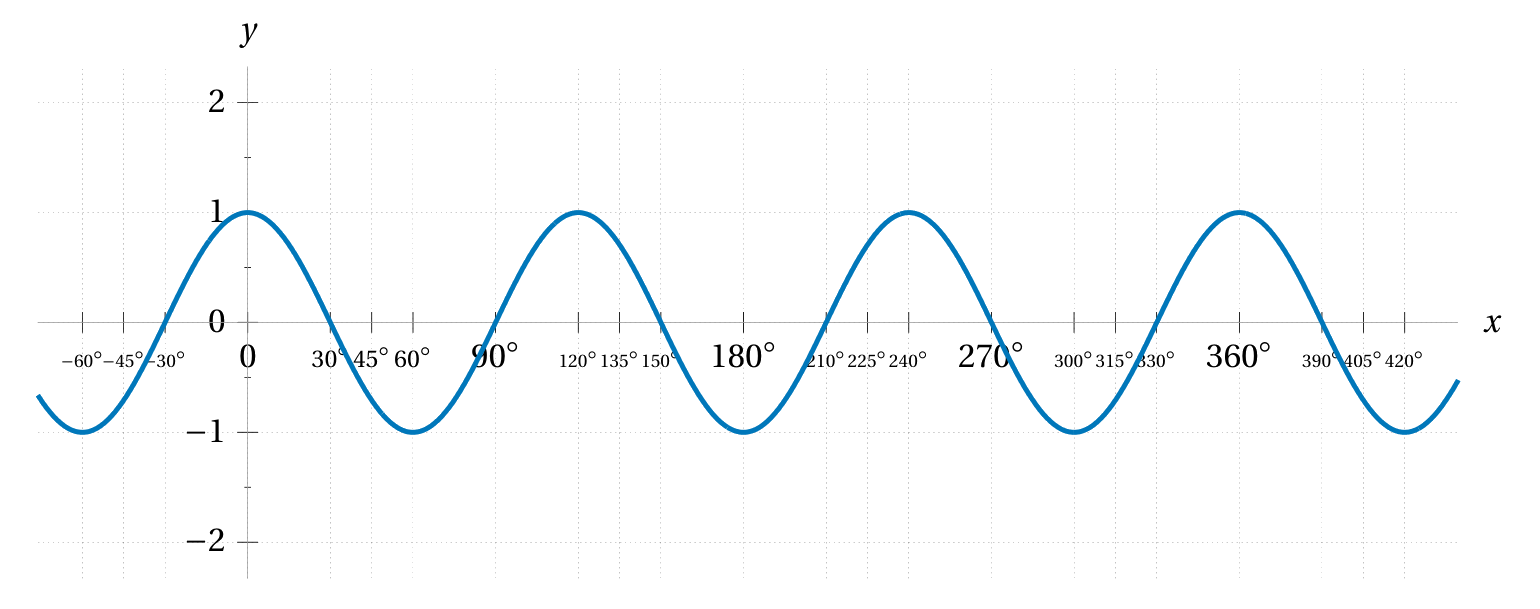
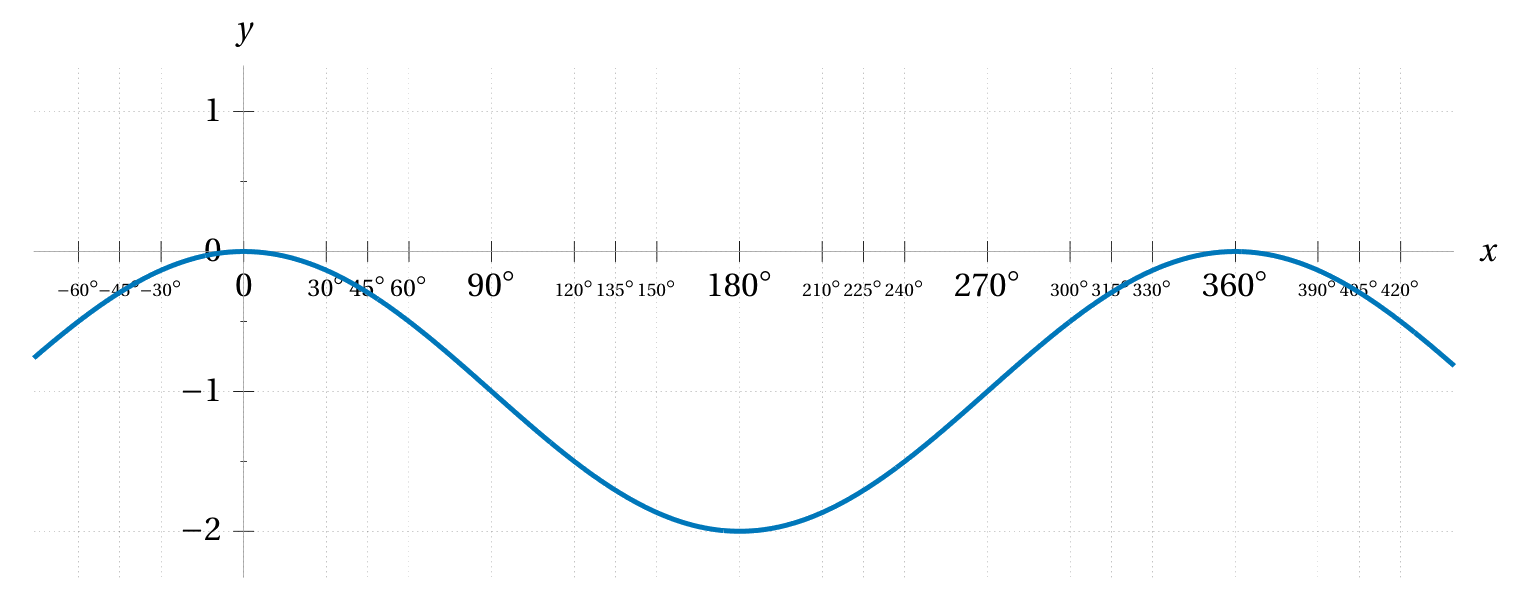
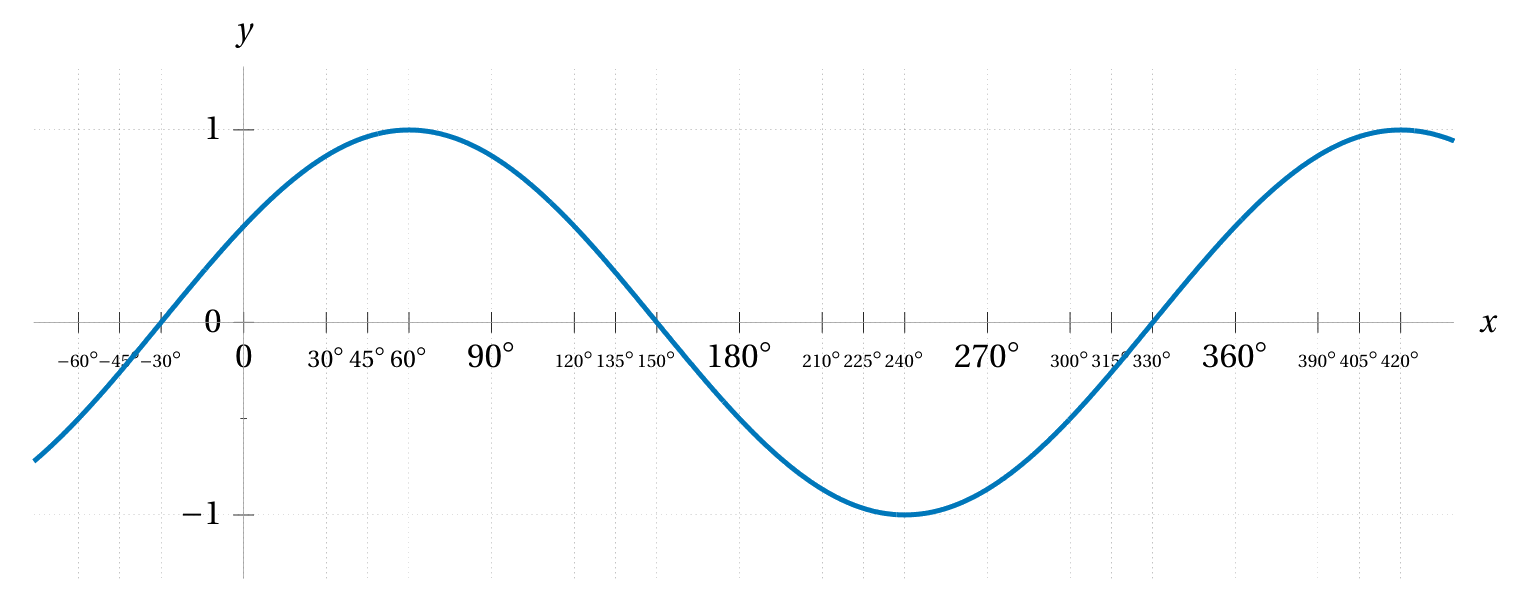
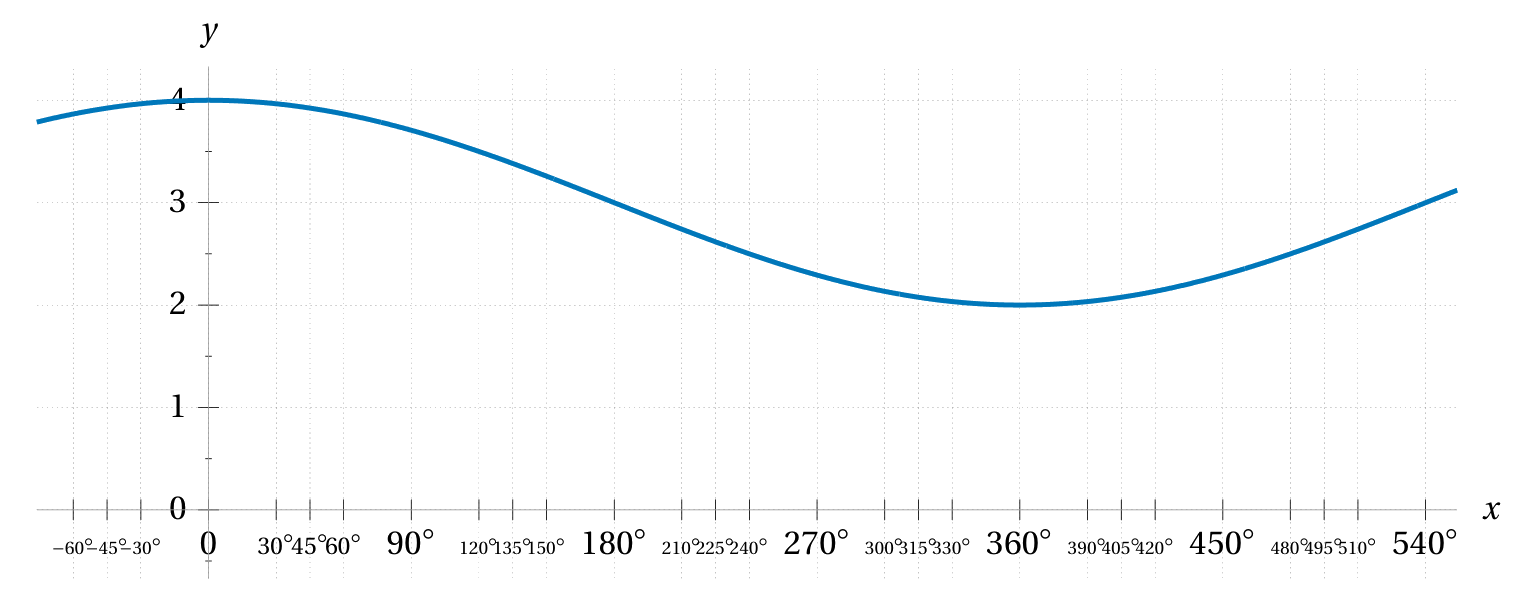
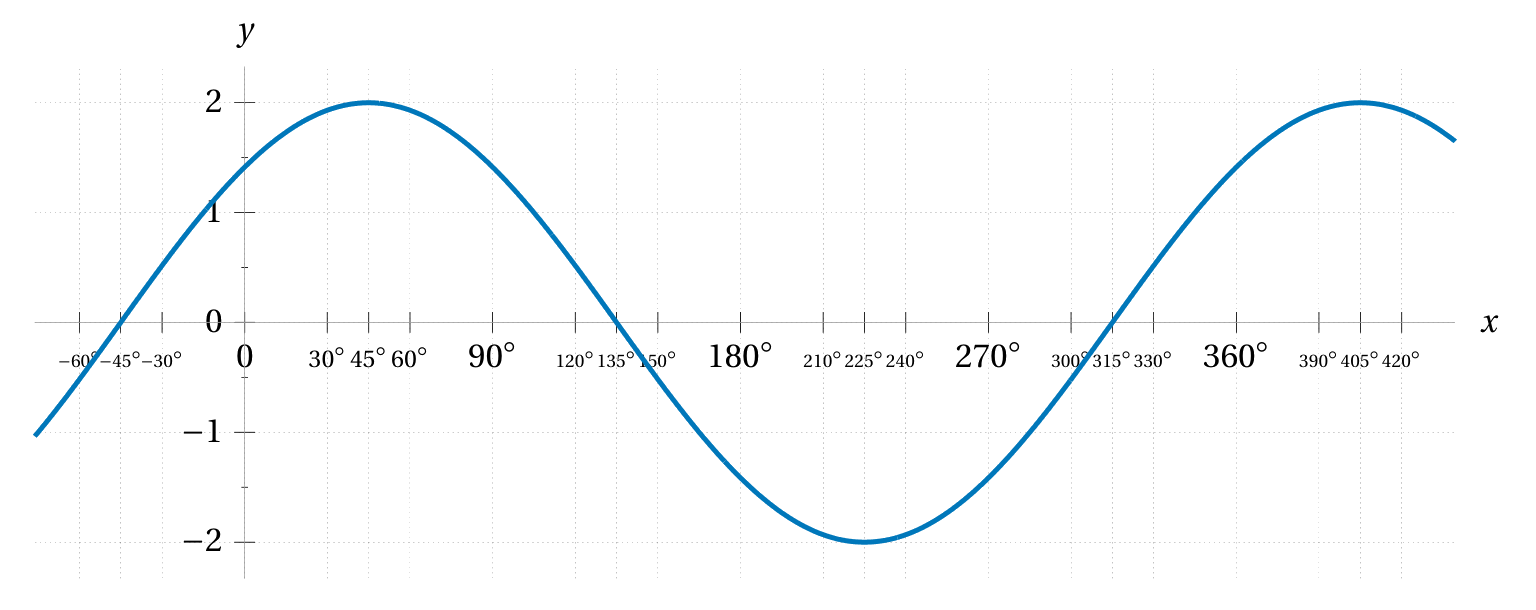
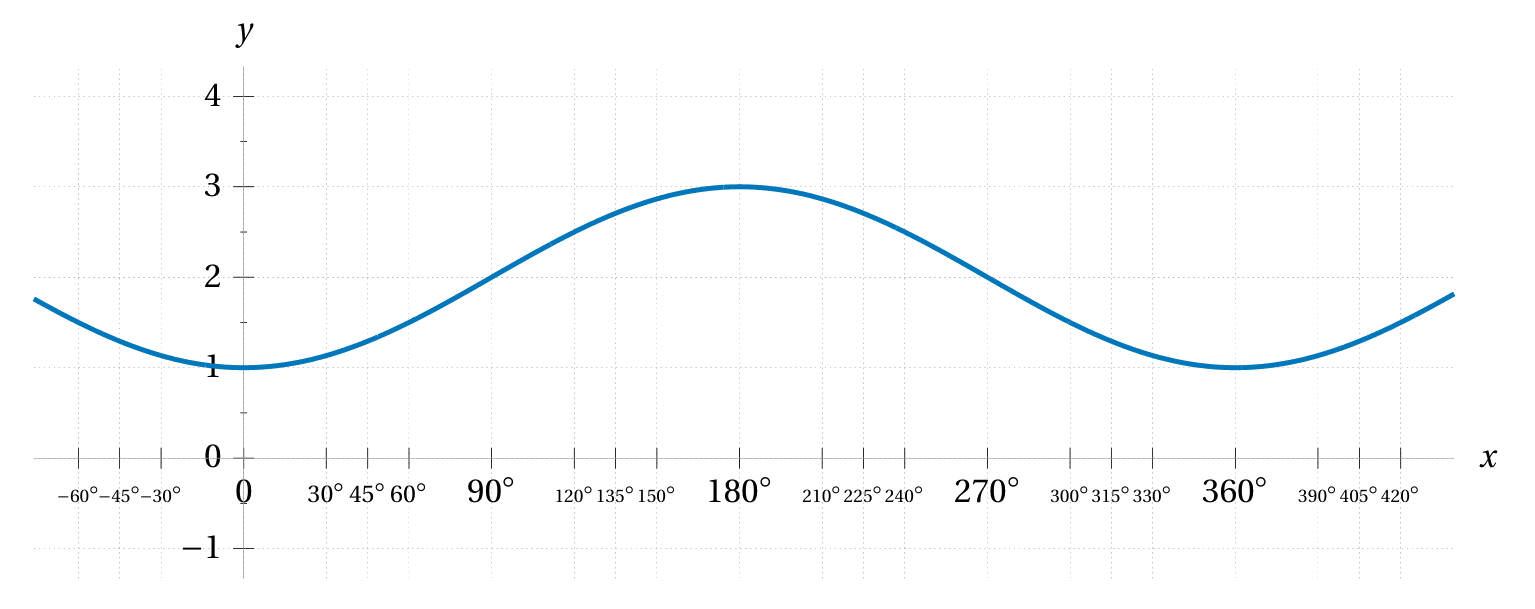
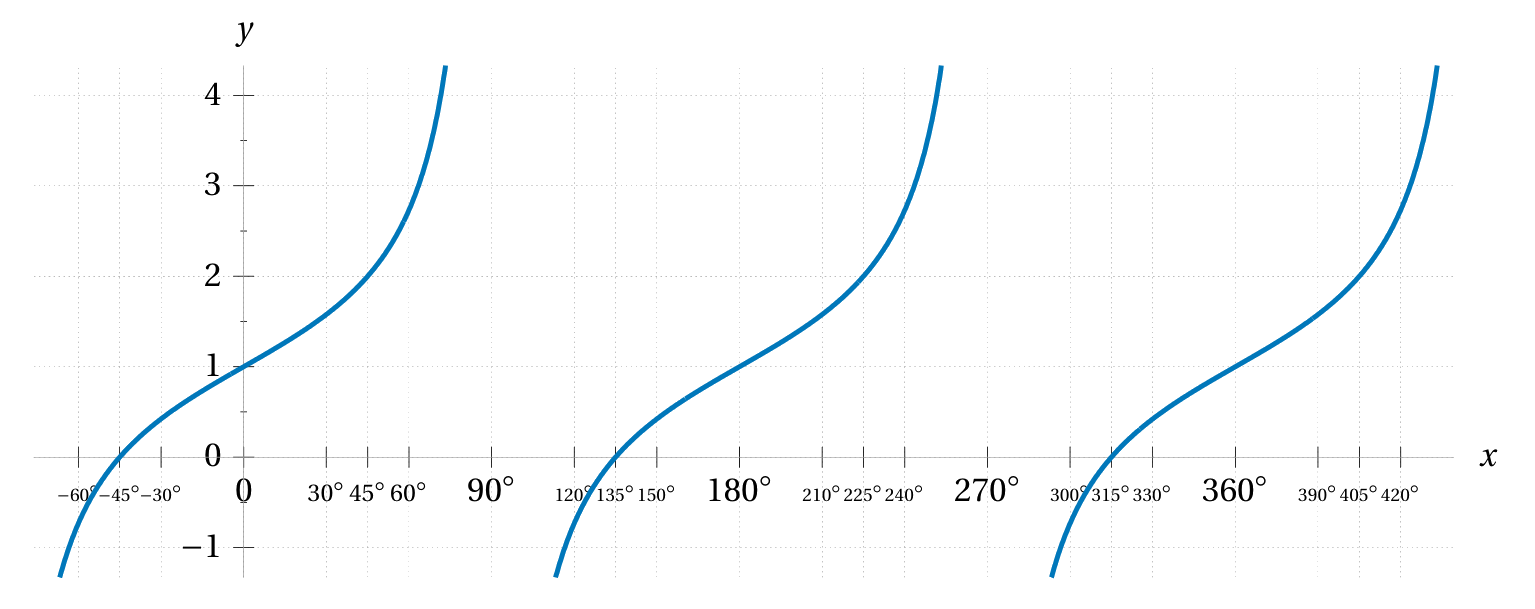
For each of the following curves below write down a formula for the function whose graph is that curve. Once you’re confident you’ve written down the correct formula, use a graphing calculator to plot the graph of your function to compare.
