The graph of a function \(f\) is the curve
consisting of all the points \(\bigl(x, f(x)\bigr)\) in the \(xy\)-plane.
A curve that is based on the graph of the sine or cosine function
is called a sinusoidal curve.
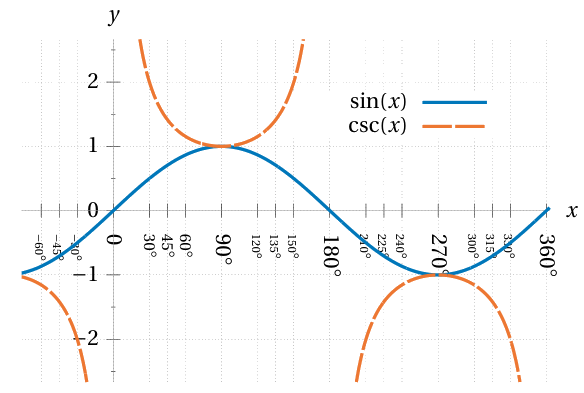
Sine and cosine are periodic functions,
with a period of \(360°.\)
This means that for any integer \(n\) we have
\(\sin(x) = \sin(x + 360\!°) = \dotsb = \sin(x + 360\!° n).\)
The mean level of a sinusoidal curve is the height of its midline.
The amplitude of a sinusoidal is its maximal change in height
from its mean; the default amplitude is one.
The phase shift of a sinusoidal is the horizontal shift
of the curve away from its parent sine/cosine graph.
Altogether, the graph of \(a\sin\bigl(k(x+b)\bigr) + v\)
will have period \(\frac{360°}{k},\)
mean level \(v,\) amplitude \(|a|,\) and phase shift \(-b.\)
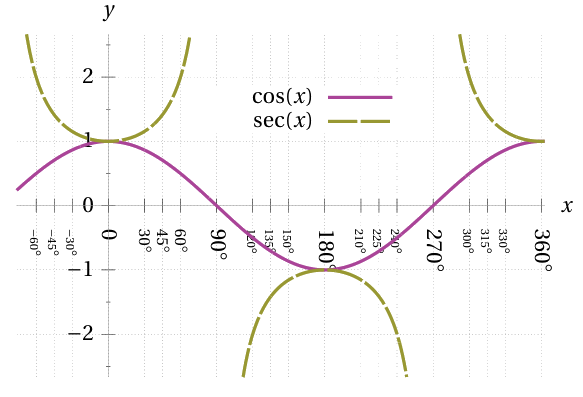
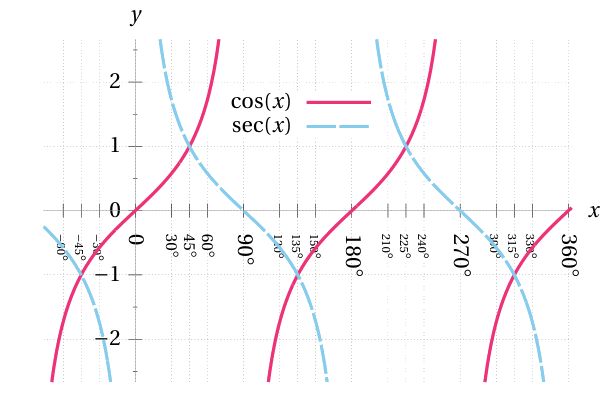
Secant and cosecant have a period of \(360°\) too,
whereas tangent and cotangent have a period of \(180°.\)
The graphs of these latter functions have vertical asymptotes
at the holes in their domain caused by division-by-zero.
The graph of a function \(f\) is the curve
consisting of all the points \(\bigl(x, f(x)\bigr)\) in the \(xy\)-plane.
A curve that is based on the graph of the sine or cosine function
is called a sinusoidal curve.
Sine and cosine are periodic functions,
with a period of \(360°.\)
This means that for any integer \(n\) we have
\(\sin(x) = \sin(x + 360\!°) = \dotsb = \sin(x + 360\!° n).\)
The mean level of a sinusoidal curve is the height of its midline.
The amplitude of a sinusoidal is its maximal change in height
from its mean; the default amplitude is one.
The phase shift of a sinusoidal is the horizontal shift
of the curve away from its parent sine/cosine graph.
Altogether, the graph of \(a\sin\bigl(k(x+b)\bigr) + v\)
will have period \(\frac{360°}{k},\)
mean level \(v,\) amplitude \(|a|,\) and phase shift \(-b.\)
Secant and cosecant have a period of \(360°\) too,
whereas tangent and cotangent have a period of \(180°.\)
The graphs of these latter functions have vertical asymptotes
at the holes in their domain caused by division-by-zero.